An agency P&L tool that prices itself on what it ships, not on a per-seat lie.
“We needed to know which projects were actually making money — across 46 resources, 6 active engagements, three currencies. Spreadsheets had become the bug.”
Case capture
SaaS · Profitability
proof capture
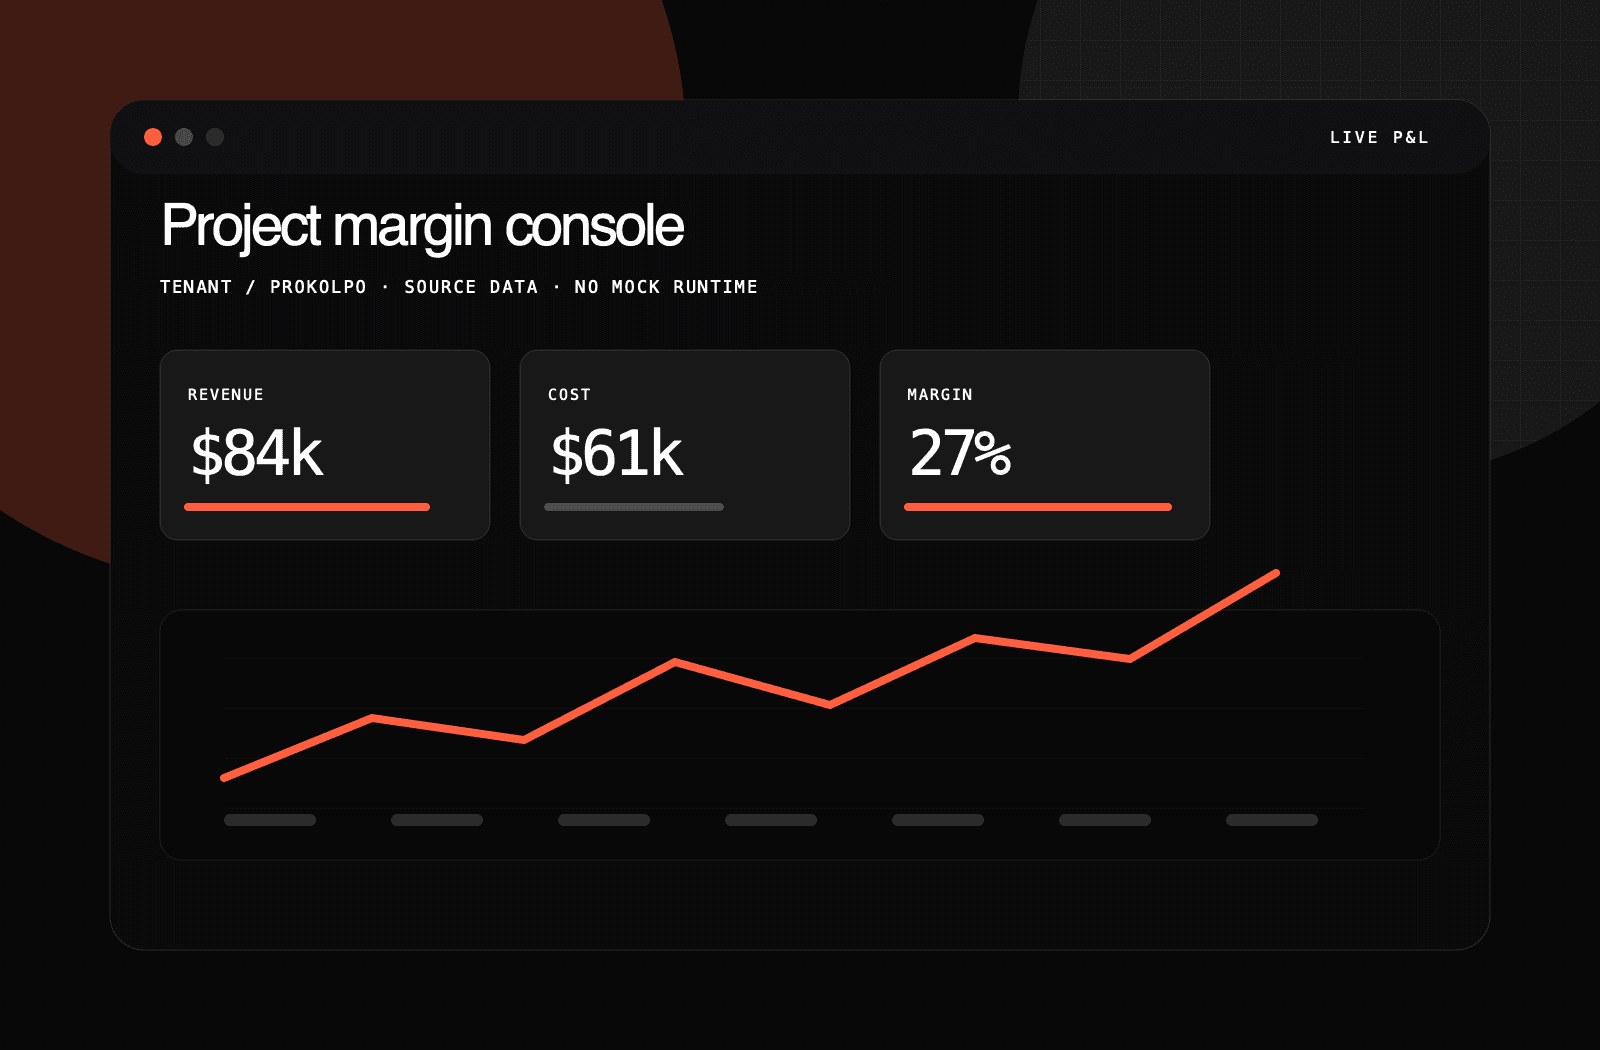
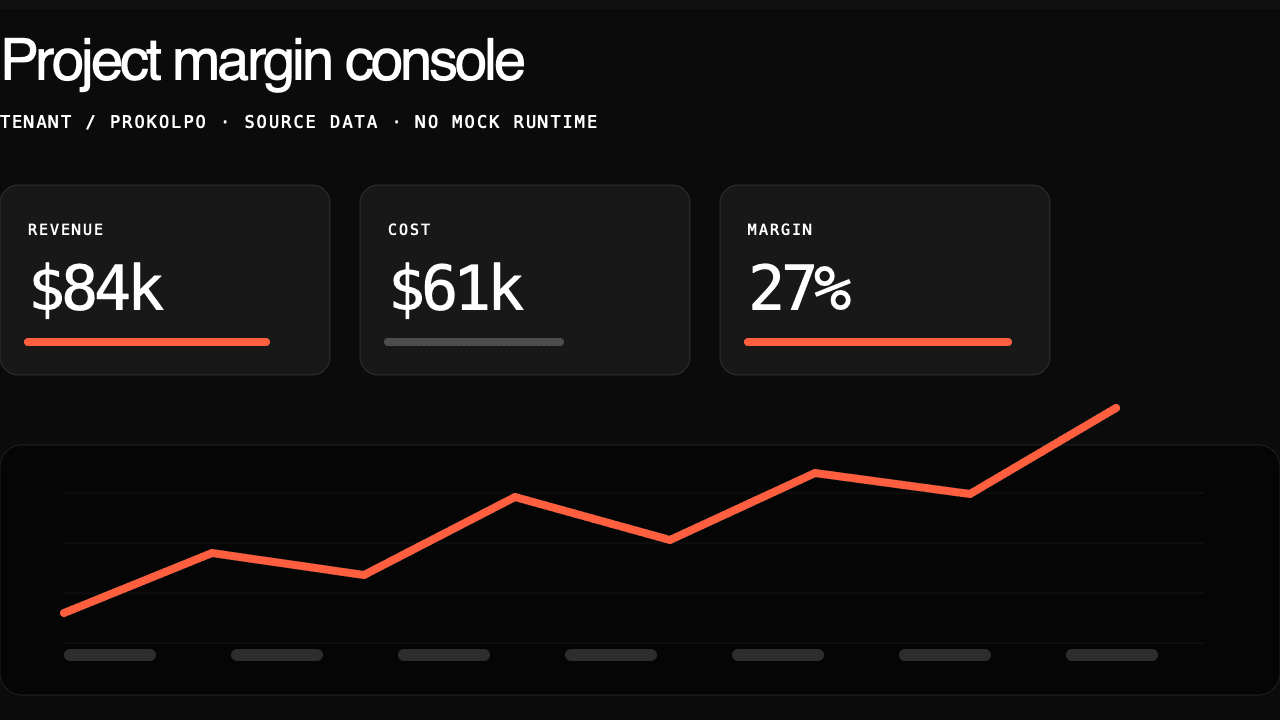
live p&l
Revenue
$84k
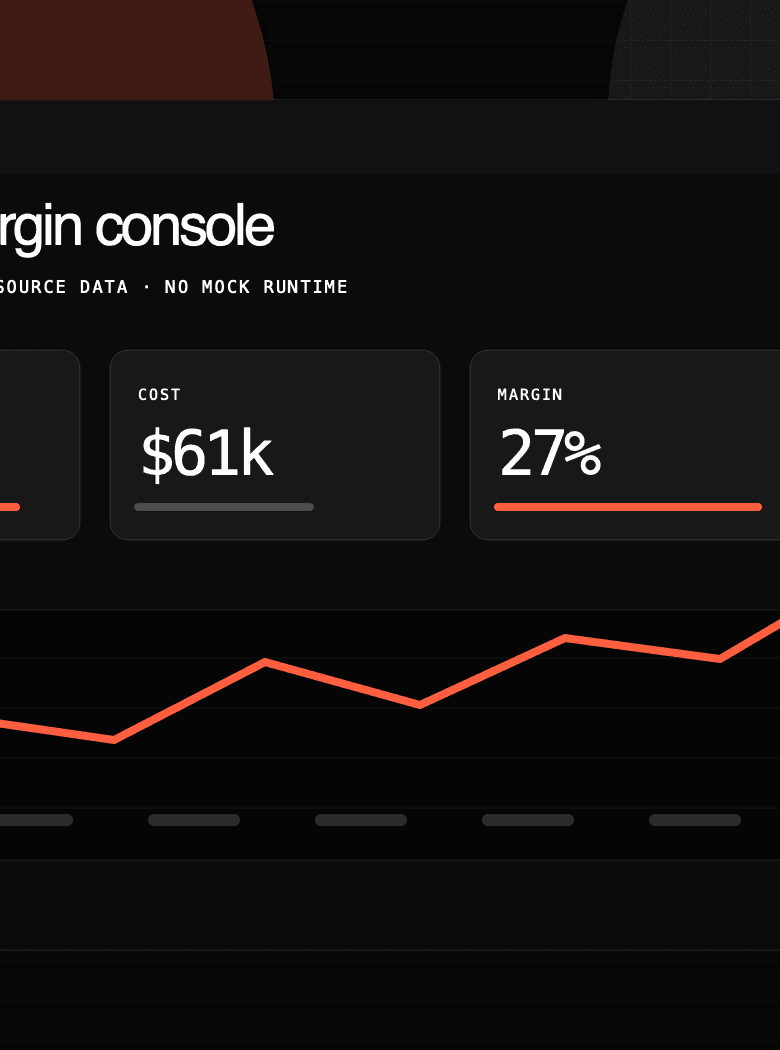
Cost
$61k
Margin
27%
margin trace
Resup margin
46 resources
39 RLS policies
Year
2026
Stack
Next.js · Supabase · Postgres RLS · live P&L
Primary buyer
Agency operator
Core surface
Project margin visibility
Trust boundary
Tenant-scoped Postgres RLS
Handoff
Production stack, no mock runtime
Named the spreadsheet bug
Diagnose
Boutique agencies survive on 12–18% margins. Most don't know which projects earn that and which burn it until quarter-end — by which time the cash is gone. The data exists (timesheets, salaries, invoices) but it lives in three systems and reconciles by hand.
proof capture
live p&l
Revenue
$84k
Cost
$61k
Margin
27%
margin trace
Resup margin
46 resources
39 RLS policies
Profitability system map
Next.js · Supabase · Postgres RLS · live P&L
We rebuilt the join: hours × rates × milestones × salary, computed live, with Postgres RLS keeping each agency's books cleanly scoped. No mock data in the runtime path. No daily ETL. The dashboard renders from the source of truth on every load.
proof capture
live p&l
Revenue
$84k
Cost
$61k
Margin
27%
margin trace
System diagram
Profitability system map
Timesheets
Hours
Rates
Billable
Payroll
Cost
Milestones
Revenue
RLS
Tenant guard
Margin view
Live P&L
Profit margin lookup
<200ms
Per-project profit margin visible in 200ms. Drift caught the same week, not the same quarter. Runs on Supabase free tier — costs the agency $0 until they hire a 47th resource.
Profit margin lookup
<200ms
p95
RLS policies
39
9 tables
Mock-data drift
0
runtime refs
Free-tier cost
$0
/mo
The actual problem, named.
Boutique agencies survive on 12–18% margins. Most don't know which projects earn that and which burn it until quarter-end — by which time the cash is gone. The data exists (timesheets, salaries, invoices) but it lives in three systems and reconciles by hand.
Diagnose first. Build second.
We rebuilt the join: hours × rates × milestones × salary, computed live, with Postgres RLS keeping each agency's books cleanly scoped. No mock data in the runtime path. No daily ETL. The dashboard renders from the source of truth on every load.
Named the spreadsheet bug
The real leak was not reporting. It was late reconciliation across hours, rates, milestones, salaries, and invoices.
Modeled the operating truth
Margin became a live computation, not a quarterly spreadsheet ritual.
Shipped the dashboard path
The product now renders from source data with tenant boundaries enforced at the database layer.
Kept the data layer honest
RLS and migration audits make drift visible before it becomes a founder surprise.
System diagram
Profitability system map
Timesheets
Hours
Rates
Billable
Payroll
Cost
Milestones
Revenue
RLS
Tenant guard
Margin view
Live P&L
proof capture
live p&l
Revenue
$84k
Cost
$61k
Margin
27%
margin trace
Resup margin
46 resources
39 RLS policies
Receipt / 01
<200ms
Profit margin lookup. p95
Stack / live
Next.js · Supabase · Postgres RLS · live P&L
Product capture
A real media surface.
How earns trust with image density. This gives each SirVibez case a loaded, inspectable product still before the page returns to the receipts.
More image, less explanation.
A premium case page needs rhythm: full surface, cropped interface, then close detail. The work should get easier to inspect with every scroll.
Premium case pages need more than claims. These stills turn the operating evidence into inspectable media.
Product still
Prokolpo / Resup
Live surface.
Per-project profit margin visible in 200ms. Drift caught the same week, not the same quarter. Runs on Supabase free tier — costs the agency $0 until they hire a 47th resource.
Profit margin lookup
<200ms
p95
RLS policies
39
9 tables
Mock-data drift
0
runtime refs
Free-tier cost
$0
/mo
Numbers we ran weekly. Numbers we own.
- Profit margin lookup<200msp95
- RLS policies399 tables
- Mock-data drift0runtime refs
- Free-tier cost$0/mo
Premium case pages need more than claims. These stills turn the operating evidence into inspectable media.
System still
Prokolpo / Resup
System map.
Profitability system map
01
Timesheets
Hours
02
Rates
Billable
03
Payroll
Cost
04
Milestones
Revenue
05
RLS
Tenant guard
More proof per scroll.
The page should feel expensive because the work is inspectable: scope, system nodes, evals, and operating decisions stacked like production stills.
Scope / 01
Agency operator
Primary buyer
Scope / 02
Project margin visibility
Core surface
Scope / 03
Tenant-scoped Postgres RLS
Trust boundary
Scope / 04
Production stack, no mock runtime
Handoff
Node / 01
Timesheets
Hours
Node / 02
Rates
Billable
Node / 03
Payroll
Cost
Node / 04
Milestones
Revenue
What's in production today.
Per-project profit margin visible in 200ms. Drift caught the same week, not the same quarter. Runs on Supabase free tier — costs the agency $0 until they hire a 47th resource.
The artifact layer,
not just the story.
Howe wins by letting visuals carry trust. SirVibez needs receipts that feel like product evidence: interface states, system maps, eval panels, and operating traces.
proof capture
live p&l
Revenue
$84k
Cost
$61k
Margin
27%
margin trace
Resup margin
46 resources
39 RLS policies
Eval trace
<200ms
Profit margin lookup
Scope receipt
Agency operator
Primary buyer
proof capture
live p&l
Revenue
$84k
Cost
$61k
Margin
27%
margin trace
Ship trace
01 · Diagnose
Named the spreadsheet bug
02 · Design
Modeled the operating truth
03 · Deploy
Shipped the dashboard path
04 · Defend
Kept the data layer honest
View more work